
Not every “great deal” is truly great. Before you commit to buying, pause and ask yourself:
1. How does this district compare to others in terms of ROI?
When analyzing investment opportunities, it is not enough to look at a city as a whole — the real story often lies at the neighborhood level. Two districts in León, Las Ventas and La Asunción – La Inmaculada, illustrate just how different outcomes can be within the same city.
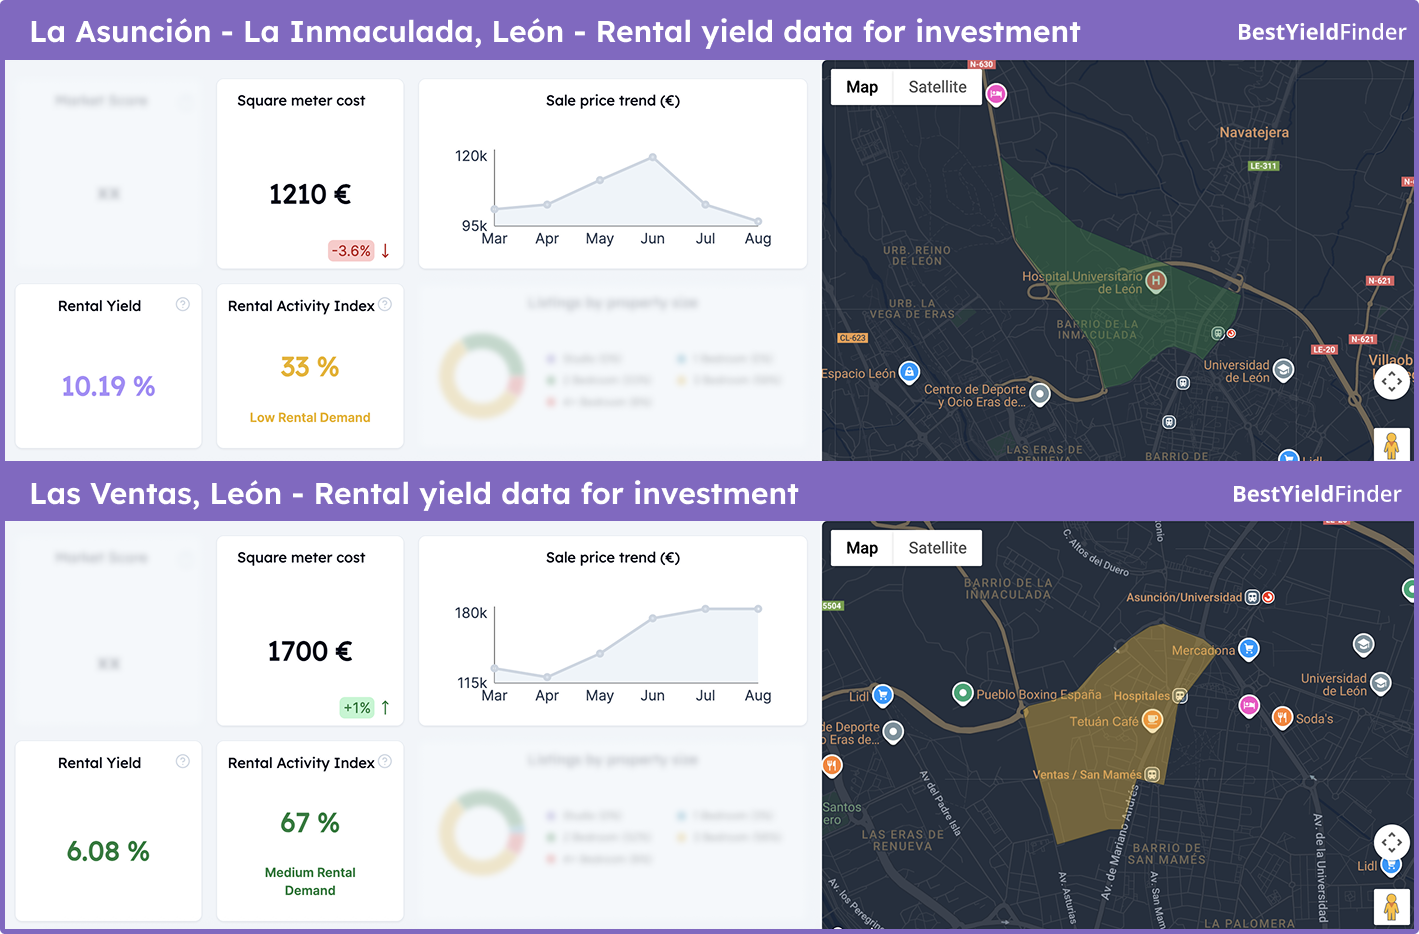
In Las Ventas, the average property price stands at around €1,700 per square meter, with a rental yield of 6.08%. Over the past few months, prices climbed from roughly €115,000 in March to €180,000 in July, before leveling off. This pattern suggests a district with moderate profitability, supported by a market that has reached a point of stability. For investors, the appeal lies in its balance — yields may not be spectacular, but the steady trend reduces long-term risk.
By contrast, La Asunción – La Inmaculada tells a very different story. Prices here are lower, at about €1,210 per square meter, and the rental yield appears strikingly high at 10.19%. At first glance, this figure could tempt any investor. However, a closer look reveals important caveats: the Rental Activity Index is just 33%, indicating weak tenant demand, and recent price movements have been highly volatile. After rising from ~€95,000 in March to €120,000 in June, property values quickly dropped back to their starting point by August. What looks like a “gold mine” on paper may, in practice, involve long vacancy periods and uncertain returns.
The comparison between these two neighborhoods highlights an essential truth: headline yields can be deceptive. A double-digit ROI means little without sufficient rental demand to support it. In many cases, districts with more modest yields — but steadier market fundamentals — provide the more reliable path to long-term profitability.
Source: www.bestyieldfinder.com, www.idealista.com
2. What property types perform best here?
Looking at León, the numbers reveal a clear hierarchy in terms of rental yield. Studios lead the market with an average yield of 6.75%, supported by relatively low entry prices (around €124,500) and steady monthly rents (€700). Close behind are one-bedroom apartments, which generate about 6.04%, offering a similar balance of affordability and demand.
As properties get larger, however, profitability starts to decline. Two- and three-bedroom units both return around 5.2%, despite requiring higher purchase prices of €172,000 and €195,000 respectively. The drop is even more pronounced for four-bedroom apartments, where average prices exceed €260,000 but the yield falls below 5%.
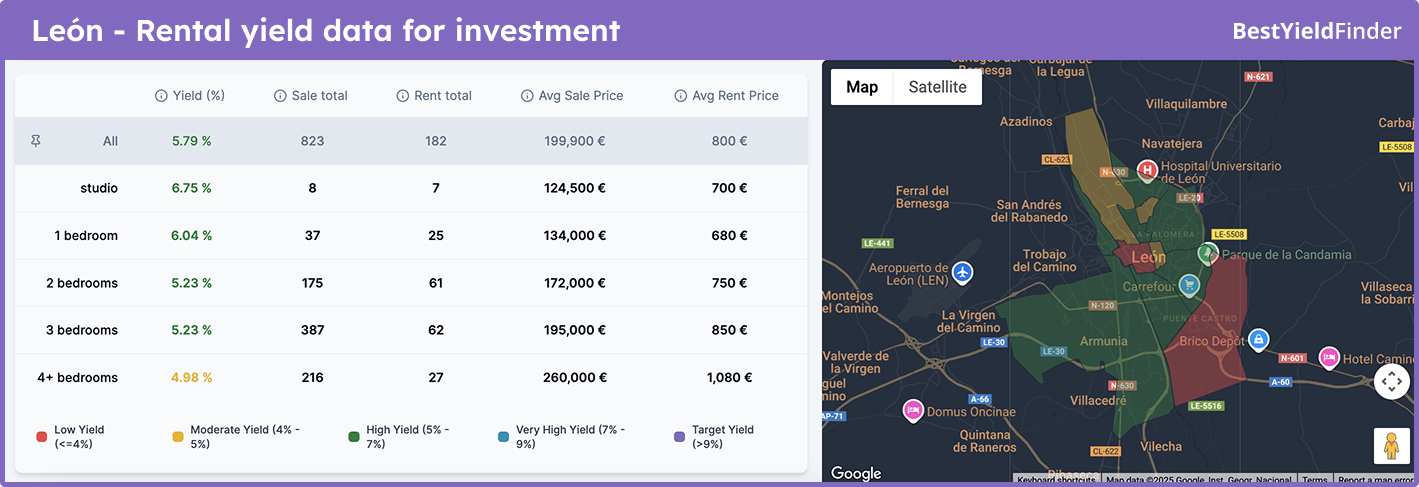
The reason is straightforward: smaller units align with León’s dominant tenant profile — students, young professionals, and single renters who value affordability and flexibility. Larger apartments cater to a narrower market segment, which often translates into longer vacancy periods and weaker overall returns.
Source: www.bestyieldfinder.com, www.idealista.com
3. Can I back my decision with real market data?
Intuition and experience always play a role in real estate decisions, but without reliable numbers, investors are often left guessing. A district may look promising, or a property type may appear attractive, yet only data can confirm whether the opportunity truly makes sense.
In practice, this means looking beyond headline yields. Investors should review:
Rental demand indicators (like the Rental Activity Index in León, which showed just 33% in La Asunción – La Inmaculada, despite double-digit yields).
Market score metrics, which highlight neighborhood stability and risk levels.
Price trends over time, revealing whether growth is sustainable or if volatility could erode returns.
By combining yield data with these additional layers of insight, investors move from speculation to strategy. A property with slightly lower ROI but stronger demand and stable pricing can easily outperform a “paper yield” that looks impressive but never materializes due to vacancies.
Final Thoughts
The examples from León show how important it is to look deeper than city averages. Two districts in the same city can deliver completely different outcomes, and property type plays an equally crucial role in determining profitability.
For investors, the real challenge is not finding opportunities — it’s filtering the noise and focusing on reliable numbers. That’s why we built BestYieldFinder: a platform that turns scattered data into clear insights on yields, rental demand, and market trends at the district level.
If you’re planning to invest abroad, tools like this can help you make faster, smarter, and more confident decisions. You can explore the data for yourself on BestYieldFinder.com.