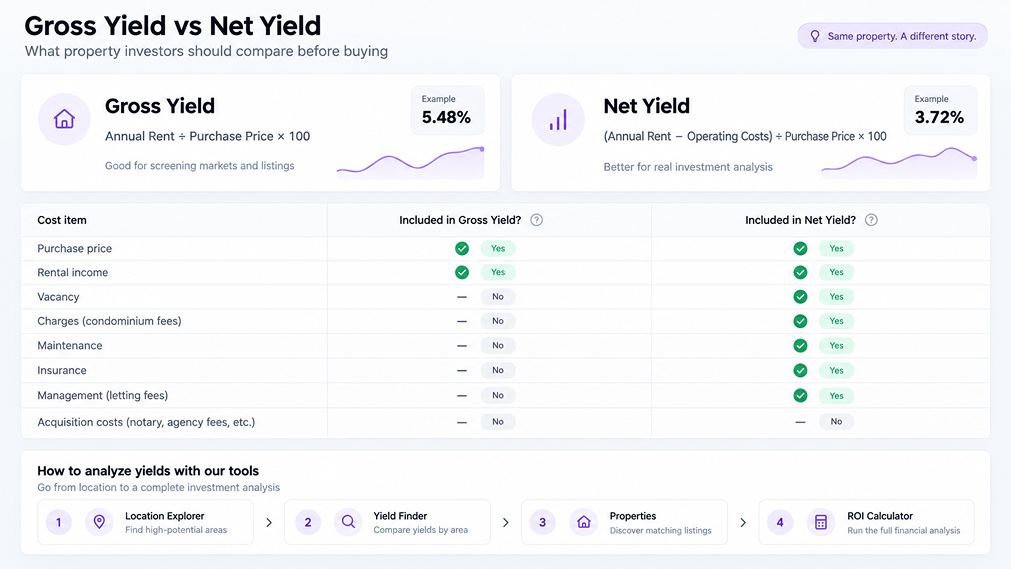
A property showing a 5% or 6% rental yield does not mean the investor actually keeps 5% or 6% per year.
That number is usually gross rental yield.
It is useful for quickly comparing properties and markets, but it ignores many of the costs that determine the actual performance of an investment.
Once vacancy, building charges, maintenance, insurance, management and acquisition costs are included, the return can look very different.
In this guide, we explain the difference between gross yield and net yield and use two real apartment listings in Nantes, France, to show how the numbers change in practice.
What is gross rental yield?
Gross rental yield compares annual rental income with the purchase price.
The formula is simple:
Gross Rental Yield = Annual Rent ÷ Purchase Price × 100
For example, if a property costs €200,000 and generates €12,000 per year in rent:
€12,000 ÷ €200,000 × 100 = 6% gross yield
This makes gross yield useful when comparing:
- cities
- districts
- apartment types
- individual listings
It answers one basic question:
How much rental income does the property generate relative to its price?
But it does not answer:
How much of that income will the investor actually keep?
Gross yield is a screening metric, not the final return.
It does not include vacancy, operating costs, taxes, maintenance, management or financing.
What is net rental yield?
Net rental yield goes one step further.
Instead of looking only at rent, it subtracts the costs required to operate the property.
A simplified formula is:
Net Rental Yield = (Annual Rent − Annual Operating Costs) ÷ Property Price × 100
Operating costs can include:
- vacancy
- condominium or copropriété charges
- maintenance
- insurance
- property management
- owner-paid utilities
- property taxes
- other recurring expenses
This is why two properties with similar gross yields can produce very different net returns.
Gross yield vs net yield at a glance
| Metric | Gross Yield | Net Yield |
|---|---|---|
| Purchase price | ✓ | ✓ |
| Rental income | ✓ | ✓ |
| Vacancy | — | ✓ |
| Maintenance | — | ✓ |
| Insurance | — | ✓ |
| Building charges | — | ✓ |
| Management | — | ✓ |
| Property tax | — | ✓ |
| Better for market comparison | ✓ | |
| Better for actual investment analysis | ✓ |
The two metrics are not competing with each other.
They are useful at different stages of the investment process.
A real example from Nantes
To make the difference clearer, we looked at two apartments currently listed in Nantes.
Both are located within the broader Rond-point route de Paris market covered by BestYieldFinder.
For rental income, we use BestYieldFinder market benchmarks for comparable apartment categories.
For expenses, we use actual costs shown in the listings where available and clearly mark the remaining values as modelling assumptions.
Property A: smaller apartment, lower entry cost
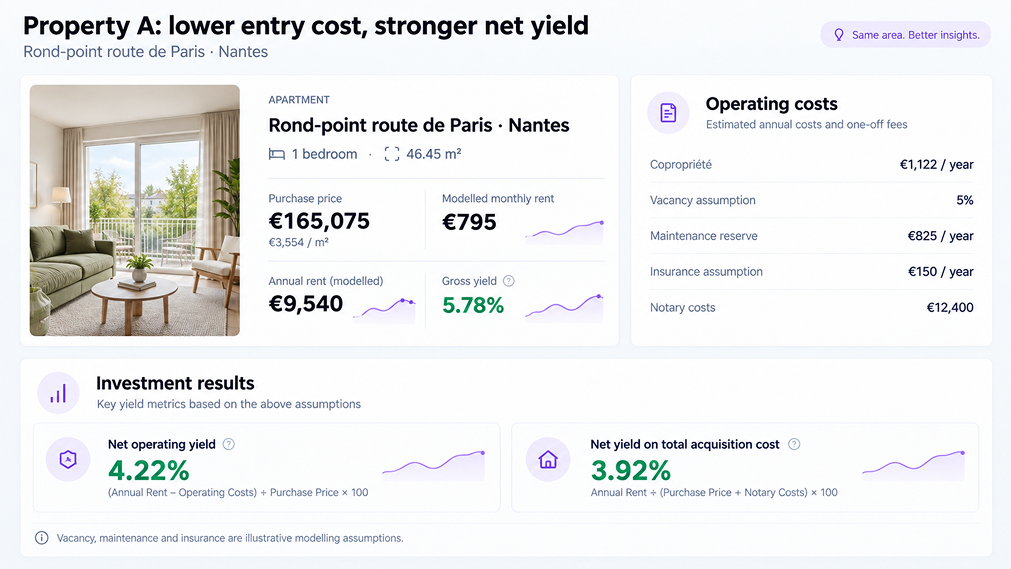
The first listing is a 46.45 m² apartment in the Chalâtres area of Nantes.
The listing shows:
- Purchase price: €165,075
- 46.45 m²
- 2 rooms / 1 bedroom
- 2nd floor
- Balcony and terrace
- Parking
- DPE: C
- Copropriété charges: €1,122/year
- Estimated notary costs: €12,400
The listing price includes buyer-paid agency fees.
Source: SeLoger — Nantes apartment listing
Using the BestYieldFinder benchmark for a comparable 40–50 m² apartment in the area, we model monthly rent at approximately:
€795/month
That gives annual rental income of:
€9,540
Gross yield
€9,540 ÷ €165,075 = 5.78%
At first glance:
Gross Yield: 5.78%
Not bad.
But now we add operating costs.
Modelling the real operating return
For this example, we use the following assumptions:
| Cost | Amount |
|---|---|
| Annual rent | €9,540 |
| Vacancy allowance | 5% |
| Copropriété charges | €1,122 |
| Maintenance reserve | 0.5% of purchase price |
| Insurance assumption | €150/year |
The €1,122 copropriété charge is taken directly from the listing.
Vacancy, maintenance and insurance are illustrative assumptions used only to demonstrate the calculation.
Step 1 — Vacancy
5% of €9,540:
€477
Effective rental income:
€9,063
Step 2 — Maintenance reserve
0.5% of €165,075:
≈ €825/year
Step 3 — Other operating costs
- Copropriété: €1,122
- Insurance assumption: €150
Estimated annual operating income becomes approximately:
€6,966
Illustrative net yield
€6,966 ÷ €165,075 ≈ 4.22%
So:
5.78% gross → approximately 4.22% net operating yield
And we still have not included income tax, financing or property tax.
Acquisition costs change the picture again
The listing estimates notary costs at approximately €12,400, bringing the estimated total project cost to about:
€177,475
If we calculate return against the total acquisition cost rather than only the advertised property price:
€6,966 ÷ €177,475 ≈ 3.92%
Now our original 5.78% headline yield has become:
3.92% on total capital invested
That is a major difference.
Compare yield against both the purchase price and total acquisition cost.
The second calculation shows how efficiently all of your invested capital is actually working.
Property B: larger apartment, higher price
Now consider a larger property in the same city.
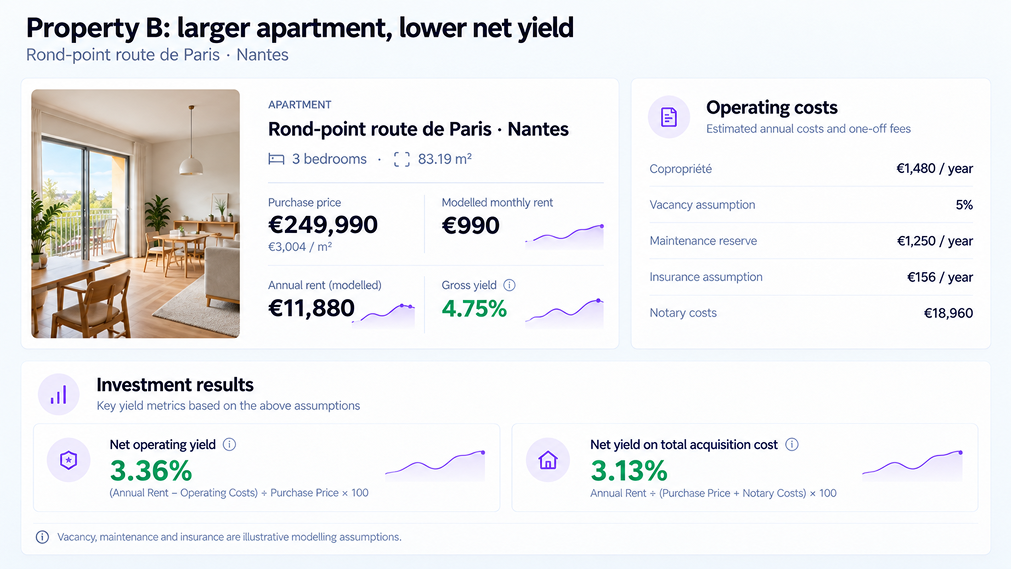
The second listing is a three-bedroom duplex of 83.19 m² on Boulevard des Poilus.
The listing shows:
- Purchase price: €249,990
- 83.19 m²
- 3 bedrooms
- Top floor
- Private parking box
- DPE: C
- Copropriété charges: €1,480/year
- Estimated notary costs: €18,960
- No current copropriété proceedings
The apartment is described as being in very good condition, with no planned works in the copropriété.
Source: SeLoger — Nantes three-bedroom apartment listing
Using the BestYieldFinder district benchmark for a 3-bedroom apartment, we model monthly rent at:
€990/month
Annual rental income:
€11,880
Property B gross yield
€11,880 ÷ €249,990 ≈ 4.75%
So the headline number is:
4.75% gross yield
Now apply the same operating assumptions.
| Cost | Amount |
|---|---|
| Annual rent | €11,880 |
| Vacancy | 5% |
| Copropriété | €1,480 |
| Maintenance reserve | 0.5% of price |
| Insurance assumption | €150 |
After vacancy and these modelled operating expenses, estimated annual operating income is approximately:
€8,406
Illustrative net yield
€8,406 ÷ €249,990 ≈ 3.36%
So:
4.75% gross → approximately 3.36% net operating yield
And after acquisition costs?
The listing estimates notary costs at approximately €18,960.
Total estimated acquisition cost:
€268,950
Against the total amount invested:
€8,406 ÷ €268,950 ≈ 3.13%
The investment therefore moves from:
4.75% gross yield
to approximately:
3.13% net yield on total acquisition cost
before property tax, income tax and financing.
The two properties side by side

| Metric | Property A | Property B |
|---|---|---|
| Purchase price | €165,075 | €249,990 |
| Modelled monthly rent | €795 | €990 |
| Annual rent | €9,540 | €11,880 |
| Gross yield | 5.78% | 4.75% |
| Copropriété | €1,122 | €1,480 |
| Estimated notary costs | €12,400 | €18,960 |
| Illustrative net operating yield | 4.22% | 3.36% |
| Net yield on total acquisition cost | 3.92% | 3.13% |
This is why comparing properties only by gross yield can be misleading.
Property A produces less annual rent in absolute terms.
But because the purchase price and operating costs are lower relative to income, the investment currently looks stronger on both gross and modelled net yield.
What if you use a property manager?
So far, we assumed the owner manages the property themselves.
If professional management costs 7% of collected rent, the numbers change again.
Using that as an illustrative scenario:
Property A
Net yield on total acquisition cost falls from approximately:
3.92% → 3.57%
Property B
It falls from approximately:
3.13% → 2.83%
The original estimated gross yields were:
5.78% and 4.75%.
The final investable economics now look much more different.
Why gross yield is still useful
None of this means gross yield is a bad metric.
It is extremely useful for screening markets quickly.
Imagine comparing 100 districts.
It would be inefficient to calculate:
- property tax
- insurance
- maintenance
- management
- financing
for every location before knowing whether the market is even interesting.
Gross yield therefore helps investors narrow the search.
A practical workflow could be:
Country → City → District → Gross Yield → Property → Net Yield
This is how the different BestYieldFinder tools can work together.
Use Location Explorer for market-level research
Location Explorer helps compare:
- median asking prices
- rents
- gross rental yields
- price per m²
- rental demand
- sales demand
- activity indexes
For the Rond-point route de Paris area in Nantes, the September 2026 district report showed:
- Median asking price: €208,100
- Median rent: €720
- Gross rental yield: 5.48%
- Median price per m²: €3,280
That gives investors context before evaluating a specific listing.
Use Yield Finder to narrow the search
If the investor already knows:
- location
- budget
- minimum acceptable yield
Yield Finder can identify areas where the numbers fit those constraints.
At this stage, gross yield is exactly the right metric.
The goal is not yet to calculate the final return down to the euro.
The goal is to find promising markets efficiently.
Use Properties to evaluate actual listings
Once a location has been shortlisted, the Properties section moves from market averages to individual opportunities.
It combines current property listings with estimates such as:
- monthly rent
- gross yield
- annual rental revenue
- price per m²
- location analysis
This makes it possible to spot differences between the listing price and the surrounding market.
But this is still the gross-yield stage of the analysis.
Then use the ROI Calculator
When a specific property becomes interesting, the calculation should become more detailed.
BestYieldFinder’s ROI Calculator allows investors to add:
- property price
- closing costs
- monthly rent
- vacancy rate
- property tax
- repairs
- insurance
- utilities
- other annual expenses
- mortgage amount
- interest rate
- loan term
It can then calculate:
- Gross Yield
- Net Yield
- Cap Rate
- Cash-on-Cash Return
- First-Year ROI
This is where the analysis moves from:
“Does this property look interesting?”
to:
“What might this investment actually produce?”
Gross yield is not ROI
Another common mistake is treating yield and ROI as interchangeable.
They are not.
Gross yield
Looks primarily at:
Rent vs property price
Net yield
Looks at:
Rent minus operating costs vs property value
ROI
Can go further by accounting for the investor’s actual capital invested.
If financing is used, ROI can differ significantly from rental yield because leverage changes both:
- cash invested
- cash flow
That is why property analysis becomes more property-specific as the investor moves closer to making a purchase.
What costs should you include?
At minimum, a realistic rental analysis should consider:
Vacancy
A property will not necessarily be occupied 365 days per year.
Building or condominium charges
For the two Nantes listings used above, these alone are:
- €1,122/year
- €1,480/year
Maintenance
Even a property in good condition requires a reserve for repairs and replacements.
Insurance
Usually relatively small compared with rent, but still part of the operating cost.
Property tax
This can materially affect net yield and should be researched for the specific property.
Management
Relevant if the investor will not manage tenants personally.
Financing
Mortgage interest and debt service change cash flow and cash-on-cash return.
Acquisition costs
Notary, legal, registration or transfer costs mean the total capital required is often higher than the advertised property price.
Do not invent costs you do not know
There is an equally important lesson here.
A precise-looking net yield is not necessarily an accurate net yield.
For the Nantes examples above, the listings give us actual:
- asking prices
- copropriété charges
- estimated notary costs
But they do not provide every investor-specific expense.
That is why we have not silently invented a property-tax bill or income-tax rate.
The vacancy, maintenance, insurance and management figures above are explicitly modelling assumptions.
Net yield is only as reliable as the assumptions behind it.
If an expense is unknown, model it as a scenario rather than presenting an estimate as a confirmed property cost.
Which metric should investors actually use?
The answer depends on the stage of research.
Comparing countries or cities?
Use gross yield.
Comparing dozens of districts?
Use gross yield.
Shortlisting individual listings?
Start with gross yield, then check operating expenses.
Preparing to make an offer?
Use net yield and total acquisition cost.
Using a mortgage?
Calculate cash flow, cash-on-cash return and ROI as well.
In other words:
Gross yield helps you find the property. Net yield helps you decide whether to buy it.
Final thoughts
Rental yield becomes more useful as the calculation becomes more realistic.
A 5.78% gross yield sounds attractive.
But after vacancy, building charges, maintenance and insurance, our first Nantes example falls to roughly 4.22%.
Once acquisition costs are included, it falls again to approximately 3.92% on total capital invested.
The second property moves from approximately 4.75% gross to 3.13% on total acquisition cost under the same illustrative framework.
Neither means the property is automatically good or bad.
The point is that the headline percentage is only the beginning of the analysis.
BestYieldFinder can support that process at different stages:
Location Explorer → understand the market.
Yield Finder → find high-yield locations for your budget.
Properties → evaluate current listings.
ROI Calculator → include real operating costs.
Report Generator → analyse a serious property candidate against its local market.
The objective is not to find the largest gross yield.
It is to understand how much of that yield may actually remain once the investment starts operating.
The net-yield examples in this article are illustrative scenarios, not forecasts. Vacancy, maintenance, insurance and management assumptions are modelled for educational purposes. Property tax, income tax and financing are not included unless stated. Actual returns depend on the property, owner and financing structure.