
A property renting for €2,000 per month may look more attractive than one renting for €900.
But for a property investor, the higher rent does not necessarily mean the better return.
Why?
Because rental income is only one side of the equation.
The other is the amount of capital required to buy the property.
A city can have very high rents and still produce relatively modest rental yields if property prices are even higher.
At the same time, a market with lower rents can generate stronger returns when acquisition prices are substantially lower.
Using BestYieldFinder data from October 2026, we compared rental markets across:
- Italy
- Spain
- Poland
- Portugal
- France
The same pattern appears repeatedly:
Higher monthly rent does not automatically mean higher rental yield.
Rent should never be analyzed alone
The relevant question for investors is not simply how much rent a property generates, but how much rental income it generates relative to the price required to acquire it.
The basic relationship: rent vs property price
Gross rental yield measures the relationship between annual rental income and purchase price.
In simplified form:
Gross Rental Yield = Annual Rent / Property Price × 100
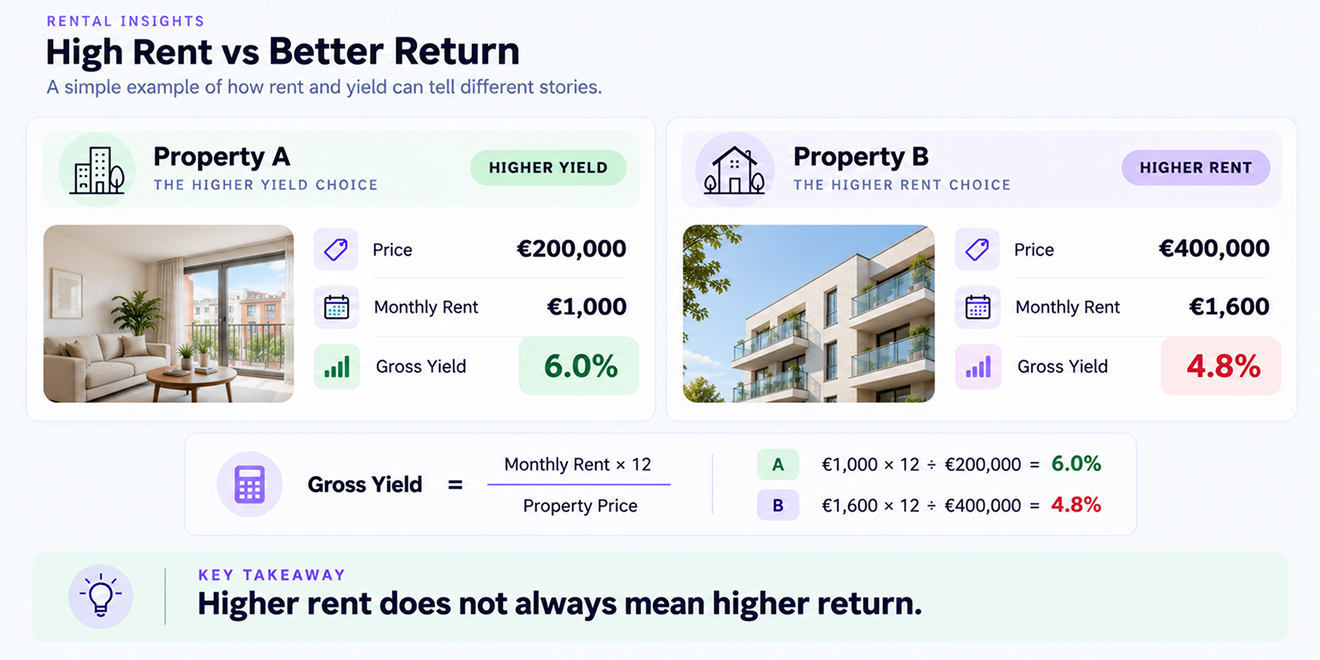
Consider two properties.
Property A
Purchase price: €200,000
Monthly rent: €1,000
Annual rent:
€12,000
Gross yield:
6.0%
Property B
Purchase price: €400,000
Monthly rent: €1,600
Annual rent:
€19,200
Property B generates €600 more rent every month.
But its purchase price is twice as high.
Its gross yield is:
4.8%
So the higher-rent property actually produces the lower return relative to its purchase price.
Higher rent and higher return are different concepts
Monthly rent measures income in absolute terms. Rental yield measures how efficiently the property’s purchase price generates that income.
Five European comparisons
The same relationship appears in real European rental markets.
| Country | Higher-Rent Market | Monthly Rent | Gross Yield | Comparison Market | Monthly Rent | Gross Yield |
|---|---|---|---|---|---|---|
| Italy | Milan | €1,400 | 5.26% | Catania | €700 | 9.03% |
| Spain | Madrid | €1,950 | 5.57% | Valencia | €1,600 | 6.24% |
| Poland | Warsaw | 3,900 zł | 5.93% | Szczecin | 2,700 zł | 6.34% |
| Portugal | Lisbon | €1,800 | 4.09% | Sintra | €1,350 | 5.10% |
| France | Paris | €2,440 | 5.75% | Marseille | €850 | 6.10% |
Source: BestYieldFinder October 2026 market data for Italy, Spain, Poland, Portugal and France.

In every pair, the city with the higher median rent has the lower gross rental yield.
But the reasons differ from country to country.
Italy: Milan rents are twice Catania’s — but the yield is much lower
Milan is one of Italy’s most expensive property markets.
Current apartment figures:
- Median asking price: €371,000
- Median monthly rent: €1,400
- Gross rental yield: 5.26%
Now compare that with Catania:
- Median asking price: €130,000
- Median monthly rent: €700
- Gross rental yield: 9.03%
Milan generates exactly twice the median monthly rent.
But the median purchase price is almost three times higher.
That is why the rental economics look completely different.
Catania’s monthly rent is lower in absolute terms, but investors need far less capital to acquire a typical apartment.
The result:
€700 rent → 9.03% yield
versus:
€1,400 rent → 5.26% yield
The purchase-price premium matters more than the rent premium
Milan’s higher rents do not compensate for the much larger difference in acquisition prices.
This does not mean Catania is automatically the better investment.
Milan also has stronger Rental Demand in the current BestYieldFinder data:
64 vs 48
That creates a different risk profile.
Catania offers stronger headline yield.
Milan offers a stronger demand signal.
Investors therefore need to compare both return and market strength.
Spain: Madrid charges more rent, Valencia generates the stronger yield
Spain gives us a less extreme but equally useful example.
- Median asking price: €473,950
- Median monthly rent: €1,950
- Gross rental yield: 5.57%
- Median asking price: €325,000
- Median monthly rent: €1,600
- Gross rental yield: 6.24%
Madrid generates around €350 more monthly rent.
But investors pay almost €149,000 more for the median apartment.
Valencia therefore produces the stronger relationship between price and rental income.
This comparison is particularly interesting because the difference in rents is relatively small compared with the difference in purchase prices.
Madrid’s median rent is around 22% higher.
Its median asking price is around 46% higher.
That imbalance pushes the gross yield lower.
Compare the rent premium with the price premium
If rents are 20% higher but property prices are 50% higher, the more expensive market may produce weaker rental economics.
Valencia also currently has a slightly higher Rental Demand score than Madrid:
68 vs 67
So in this comparison, Valencia combines:
lower entry price + slightly stronger demand + higher gross yield
That makes it particularly interesting from an income-investment perspective.
Poland: Warsaw rents are much higher, but Szczecin still wins on yield
Poland shows the same effect in złoty.
- Median asking price: 879,000 zł
- Median monthly rent: 3,900 zł
- Gross rental yield: 5.93%
- Median asking price: 569,000 zł
- Median monthly rent: 2,700 zł
- Gross rental yield: 6.34%
Warsaw generates an additional:
1,200 zł per month
But a median apartment costs around:
310,000 zł more
The higher rent therefore does not translate into a higher yield.
Szczecin delivers a slightly stronger gross return despite generating significantly less rental income every month.
The yield difference does not need to be huge to matter
Warsaw and Szczecin are relatively close on gross yield, but the capital required to enter the two markets is very different.
Warsaw still has an important advantage:
its Rental Demand score is significantly higher.
Warsaw: 80
Szczecin: 68
This is a useful reminder that the highest-yield market is not automatically the strongest overall rental market.
An investor choosing between the two is balancing:
Warsaw → higher rent + stronger demand + higher entry price
against:
Szczecin → lower entry price + slightly higher yield
Portugal: Lisbon has higher rent but weaker rental efficiency
Portugal provides one of the clearest examples.
- Median asking price: €599,900
- Median monthly rent: €1,800
- Gross rental yield: 4.09%
- Median asking price: €320,000
- Median monthly rent: €1,350
- Gross rental yield: 5.10%
Lisbon generates €450 more rent per month.
But its median asking price is almost:
€280,000 higher
That creates a much weaker price-to-rent relationship.
Sintra generates around 25% less rent than Lisbon.
But its median purchase price is approximately 47% lower.
That is why Sintra produces the higher gross yield.
A high-rent market can still be capital-inefficient
Lisbon generates more income in absolute terms, but investors also need significantly more capital to access that income.
Portugal also demonstrates why simply ranking cities by monthly rent can be misleading.
If we looked only at rental income, Lisbon would appear clearly stronger.
Once acquisition cost is added, the conclusion changes.
France: Paris generates almost three times the rent of Marseille
France provides perhaps the most dramatic example.
- Median asking price: €610,000
- Median monthly rent: €2,440
- Gross rental yield: 5.75%
- Median asking price: €239,000
- Median monthly rent: €850
- Gross rental yield: 6.10%
Paris generates nearly three times as much monthly rent.
But a median property also costs more than 2.5 times as much.
Despite the enormous difference in absolute rent, the yields are actually quite close:
Paris: 5.75%
Marseille: 6.10%
This is an important result.
Paris demonstrates that a very expensive market can still maintain competitive rental economics when rents are sufficiently high.
Marseille still wins on gross yield — but only by 0.35 percentage points.
High rents can compensate for high prices — up to a point
Paris is expensive, but its very strong rental income keeps its yield surprisingly close to Marseille.
This is why the correct conclusion is not:
“High-rent cities are bad investments.”
It is:
“High rent only helps if it is strong enough relative to the property price.”
The pattern across all five countries
The five comparisons tell the same basic story.
Italy
Milan rent:
€1,400
Catania rent:
€700
Yet Catania has the much higher yield.
Spain
Madrid rent:
€1,950
Valencia rent:
€1,600
Yet Valencia generates the stronger yield.
Poland
Warsaw rent:
3,900 zł
Szczecin rent:
2,700 zł
Yet Szczecin has the higher yield.
Portugal
Lisbon rent:
€1,800
Sintra rent:
€1,350
Yet Sintra produces the higher yield.
France
Paris rent:
€2,440
Marseille rent:
€850
Yet Marseille still slightly leads on yield.
The same pattern appears across very different European markets
Absolute rental income alone does not tell investors how efficiently their capital is being used.
But sometimes higher rent does mean better returns
There is an important nuance.
The relationship is not always inverse.
A market can have:
higher rent + higher yield
if rental income rises faster than purchase prices.
Barcelona provides a useful example within Spain.
Its median apartment rent is approximately €2,460, higher than Madrid’s €1,950.
Yet its gross rental yield is also higher at approximately 7.3%.
Why?
Because the relationship between price and rent is different.
This means investors should not apply a simple rule such as:
“Avoid cities with high rents and high property prices.”
Instead, calculate the relationship.
Never assume the outcome from rent alone
Higher rent can produce a higher or lower yield depending on what investors must pay to acquire the property.
Apartment type can completely change the result
City averages are only the first layer.
The same relationship between rent and return appears within individual markets.
Consider Paris.
Current apartment data shows approximately:
1-bedroom
- Purchase price: €270,000
- Monthly rent: €1,690
- Gross yield: 7.5%
4+ bedrooms
- Purchase price: €1,310,000
- Monthly rent: €4,580
- Gross yield: 4.2%
The larger apartment generates almost €2,900 more rent every month.
But it costs more than €1 million extra to acquire.
As a result, the smaller apartment produces the much stronger yield.
More bedrooms and higher rent do not automatically improve returns
What matters is whether the additional rent compensates for the additional acquisition cost.
This is why investors should compare:
City → District → Apartment Type → Property
rather than relying only on the headline city rent.
The Yield Finder can help identify these differences between markets and property segments.
Why investors are attracted to high-rent markets
High-rent cities can still have important advantages.
Higher absolute rents may provide:
- more monthly cash income
- a larger buffer for fixed expenses
- stronger demand in certain segments
- access to premium tenant groups
- potentially deeper rental markets
But there are also disadvantages.
Higher-rent cities often come with:
- higher purchase prices
- larger deposits or equity requirements
- higher transaction costs in absolute terms
- larger financing requirements
- greater concentration of capital in one asset
So the investment decision is not simply about maximizing rent.
Think in percentages, not just euros
Imagine choosing between:
Property A
Price: €150,000
Rent: €900/month
Annual rent:
€10,800
Gross yield:
7.2%
Property B
Price: €500,000
Rent: €2,000/month
Annual rent:
€24,000
Gross yield:
4.8%
Property B generates more than twice as much annual rent.
But Property A generates significantly more rental income relative to every euro invested.
Ask what every €100,000 of property value produces
Absolute rent tells you how much income comes in. Yield tells you how efficiently your capital generates that income.
Higher yield still does not mean higher net profit
Gross yield is only the first step.
A property with a 7% gross yield can still produce weaker net returns than a property with a 6% gross yield if expenses are higher.
Investors should also consider:
- acquisition taxes
- maintenance
- insurance
- building fees
- property management
- vacancy
- financing
- renovation
- rental taxation
For example:
Property A
Gross rental income:
€15,000
Annual expenses:
€5,000
Income after operating costs:
€10,000
Property B
Gross rental income:
€13,000
Annual expenses:
€2,000
Income after operating costs:
€11,000
Property A has higher rent.
Property B leaves the investor with more income after costs.
Do not confuse gross rental income with profit
High rent can look impressive while taxes, vacancy, maintenance and financing significantly reduce the amount investors actually keep.
Investors can use the ROI Calculator to test these wider assumptions.
Rental demand also matters
Our previous analysis showed that gross yield and Rental Demand can rank markets very differently.
For example:
- Milan has lower yield but stronger Rental Demand than Catania
- Warsaw has lower yield but stronger Rental Demand than Szczecin
- Valencia currently combines both higher yield and slightly stronger demand than Madrid
This means there are at least three separate questions:
How much rent can the property generate?
How much does the property cost?
How strong is the tenant market behind that income?
A strong investment should ideally balance all three.
How to compare rental markets properly
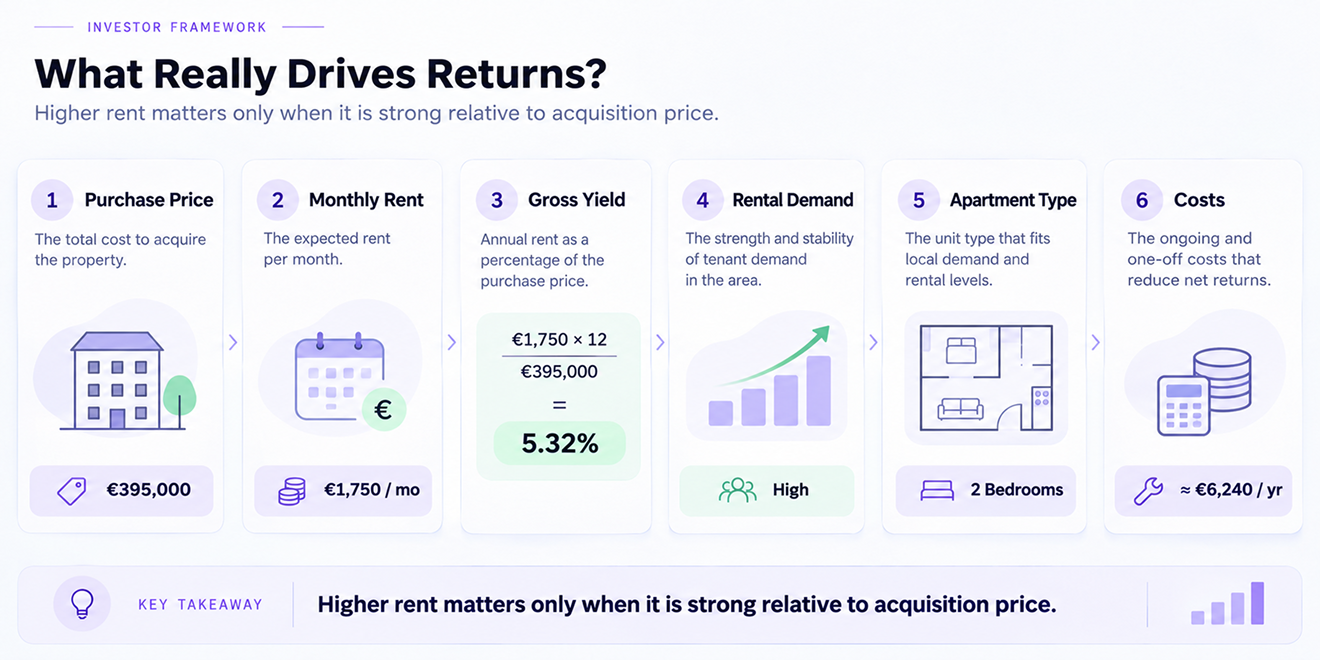
Instead of ranking cities by monthly rent, investors can follow a more useful process.
1. Compare purchase prices
How much capital is required?
2. Compare realistic monthly rents
What can comparable properties actually achieve?
3. Calculate gross yield
How much income does the purchase price generate?
4. Compare rental demand
How strong is the tenant market?
5. Compare apartment types
Do studios, 1BR, 2BR or larger apartments offer different economics?
6. Analyze districts
City averages can hide large local differences.
7. Include costs
Calculate the investment after acquisition and operating expenses.
Start with the ratio, then investigate the reason
A high or low yield is only a signal. The next step is understanding whether the difference comes from property prices, rents, demand or risk.
How BestYieldFinder can help
Start with the Location Explorer to compare prices, rents and yields across European markets.
Then use the Yield Finder to explore:
City → District → Apartment Type
Use Properties to compare current listings.
Then test the full economics using the ROI Calculator.
For a broader overview of an investment opportunity, use the Report Generator.
Final thoughts
Does higher rent mean better returns?
No — not by itself.
Across all five markets we compared, we found examples where the city with the higher median rent produced the lower gross rental yield:
Milan vs Catania
Madrid vs Valencia
Warsaw vs Szczecin
Lisbon vs Sintra
Paris vs Marseille
The reason is simple.
Rental returns depend on both:
the income generated
and
the capital required to generate it.
Do not search for the highest rent — search for the strongest relationship between rent and price
A property generating €2,000 per month is not automatically a better investment than one generating €1,000. What matters is what you have to pay to access that income.
For investors, the better question is therefore not:
“Where are rents highest?”
It is:
“Where does my invested capital generate the strongest sustainable rental income?”