
A property can generate high monthly rent and still be a weak investment if the purchase price is too high.
That is why one of the simplest ways to compare rental markets is the price-to-rent ratio.
Instead of asking only:
“How much rent can this property generate?”
investors can ask:
“How many years of gross rent would it take to match the purchase price?”
Using October 2026 BestYieldFinder data, we compared apartment rental yields across five European markets:
- Italy
- Poland
- Spain
- Portugal
- France
The differences are significant.
What is the price-to-rent ratio?
The price-to-rent ratio compares a property’s purchase price with its annual rental income.
A simplified formula is:
Price-to-Rent Ratio = Property Price / Annual Rent
For example:
- Property price: €200,000
- Monthly rent: €1,000
- Annual rent: €12,000
The price-to-rent ratio would be:
€200,000 / €12,000 = 16.7
In simple terms, this means the purchase price is equal to around 16.7 years of gross rental income.
The same idea can also be viewed through rental yield.
If gross rental yield is 6%, the approximate gross payback period is:
100 / 6 = 16.7 years
So:
- Higher gross yield = shorter theoretical payback period
- Lower gross yield = longer theoretical payback period
This is a simplified gross comparison. It does not include taxes, maintenance, vacancy, financing, property management or transaction costs.
Investors can explore current rental yields across markets using the BestYieldFinder Location Explorer.

Europe comparison: which market has the shortest gross payback?
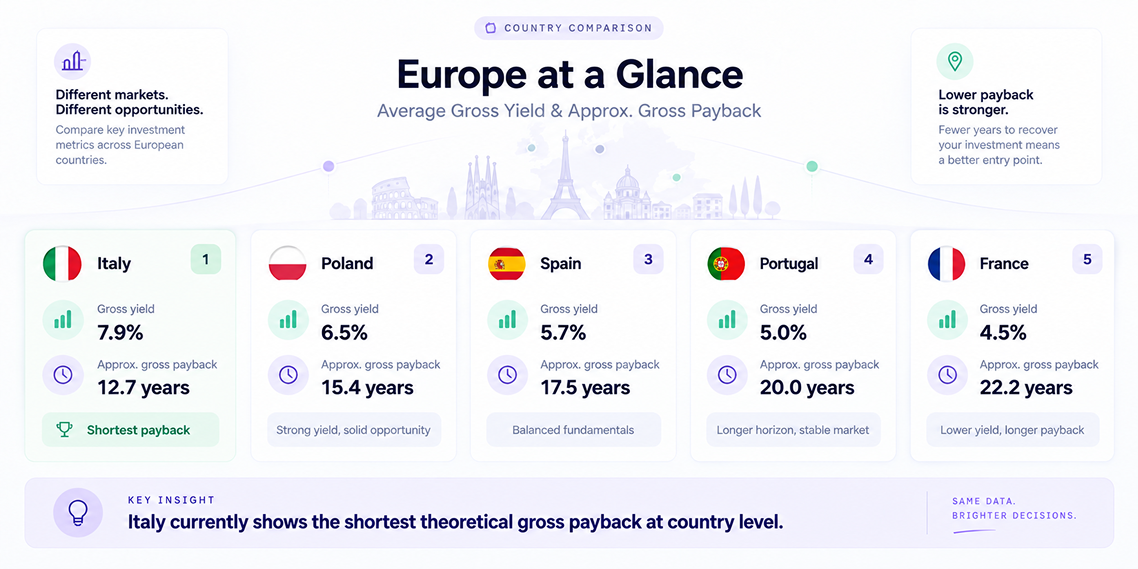
Based on average apartment gross rental yields in October 2026:
| Country | Average Gross Yield | Approx. Gross Payback |
|---|---|---|
| Italy | 7.9% | 12.7 years |
| Poland | 6.5% | 15.4 years |
| Spain | 5.7% | 17.5 years |
| Portugal | 5.0% | 20.0 years |
| France | 4.5% | 22.2 years |
Source: Italy, Poland, Spain, Portugal, France. October 2026 BestYieldFinder data.
At country level, Italy currently shows the shortest theoretical gross payback period among these five markets.
But country averages hide major differences between cities.
Italy: the shortest payback in this comparison
Italy recorded an average apartment gross rental yield of approximately 7.9% in October 2026.
That translates into an approximate gross payback period of:
12.7 years
The national median apartment asking price was around €177,000, while median monthly rent was approximately €990.
But the most interesting opportunities appear when we move below the national level.
Some Italian cities currently show considerably higher yields.
Catania
Catania recorded an average apartment gross yield of around 9.0%.
Approximate gross payback:
11.1 years
Its median apartment purchase price was around €130,000, with median monthly rent near €700.
Genoa
Genoa was close behind with an average gross yield of approximately 8.9%.
Approximate payback:
11.2 years
The city also contains apartment segments with significantly higher yields.
For example, 2-bedroom apartments were showing a median purchase price of around €99,000, median monthly rent of €890, and gross yield of approximately 10.7%.
Palermo
Palermo recorded an average gross yield of around 8.4%.
Approximate gross payback:
11.9 years
Turin
Turin followed at approximately 8.2%.
Approximate gross payback:
12.2 years
This is why Italy looks particularly interesting from a price-to-rent perspective.
The country average is already relatively strong, but certain cities and apartment types can offer even shorter theoretical payback periods.
Investors can compare these segments using the BestYieldFinder Yield Finder.
Poland: relatively balanced price-to-rent economics
Poland recorded an average apartment gross rental yield of approximately 6.5%.
That corresponds to an approximate gross payback period of:
15.4 years
The national median apartment asking price was around 599,000 zł, while median monthly rent was approximately 2,900 zł.
At city level, the differences are smaller than in Italy, but several markets remain interesting.
Szczecin
Szczecin recorded an average gross yield of around 6.3%.
Approximate gross payback:
15.9 years
Łódź
Łódź recorded an average gross yield of approximately 6.2%.
Approximate gross payback:
16.1 years
But individual apartment segments can perform much better.
For example, 1-bedroom apartments in Łódź were showing gross yields of around 7.6%, while some local areas and apartment types were even higher.
This illustrates an important point:
The country-level ratio is useful for orientation, but the real investment decision usually happens at city, district and apartment-type level.
Spain: higher prices extend the payback period
Spain recorded an average apartment gross yield of approximately 5.7%.
That implies an approximate gross payback period of:
17.5 years
The national median apartment asking price was around €260,000, with median monthly rent close to €1,200.
One reason Spain’s national payback period is longer than Italy’s is that property prices have risen considerably in many major markets.
But again, city-level data tells a more nuanced story.
Barcelona
Barcelona recorded an average apartment gross yield of around 7.3%.
That corresponds to an approximate gross payback period of:
13.7 years
Despite a much higher median purchase price of approximately €450,000, rents were also significantly higher, at around €2,460 per month.
Individual apartment segments were even stronger:
- Studio: 8.1%
- 1BR: 7.8%
- 2BR: 7.2%
- 3BR: 7.7%
This is a useful example of why expensive cities should not automatically be excluded.
A high purchase price can still produce an attractive price-to-rent ratio if rental income is proportionally strong enough.
Portugal: strong rents, but high acquisition prices
Portugal recorded an average apartment gross yield of approximately 5.0%.
Approximate gross payback:
20 years
The national median apartment asking price was around €365,000, while median monthly rent was approximately €1,390.
Portugal therefore has a noticeably longer theoretical payback period than Italy, Poland or Spain.
But certain markets perform better.
Sintra
Sintra recorded an average gross yield of approximately 5.1%.
Approximate gross payback:
19.6 years
Its median apartment purchase price was around €320,000, with median monthly rent near €1,350.
Some apartment segments performed better:
- 2BR: 5.2%
- 3BR: 5.7%
- 4+BR: 5.6%
Again, apartment size matters.
The best-performing segment in a city may have a substantially different price-to-rent ratio from the city average.
France: longer payback at national level
France recorded the lowest average apartment gross yield among the five countries in this comparison:
4.5%
That implies an approximate gross payback period of:
22.2 years
The national median apartment asking price was around €253,300, with median rent of approximately €770 per month.
However, this does not mean every French market has weak rental economics.
Marseille
Marseille recorded an average gross apartment yield of approximately 6.1%.
Approximate gross payback:
16.4 years
That is much closer to Poland than to the French national average.
1-bedroom apartments in Marseille were showing:
- Median purchase price: around €105,000
- Median monthly rent: around €620
- Gross yield: approximately 7.1%
This demonstrates how misleading national averages can be when used alone.
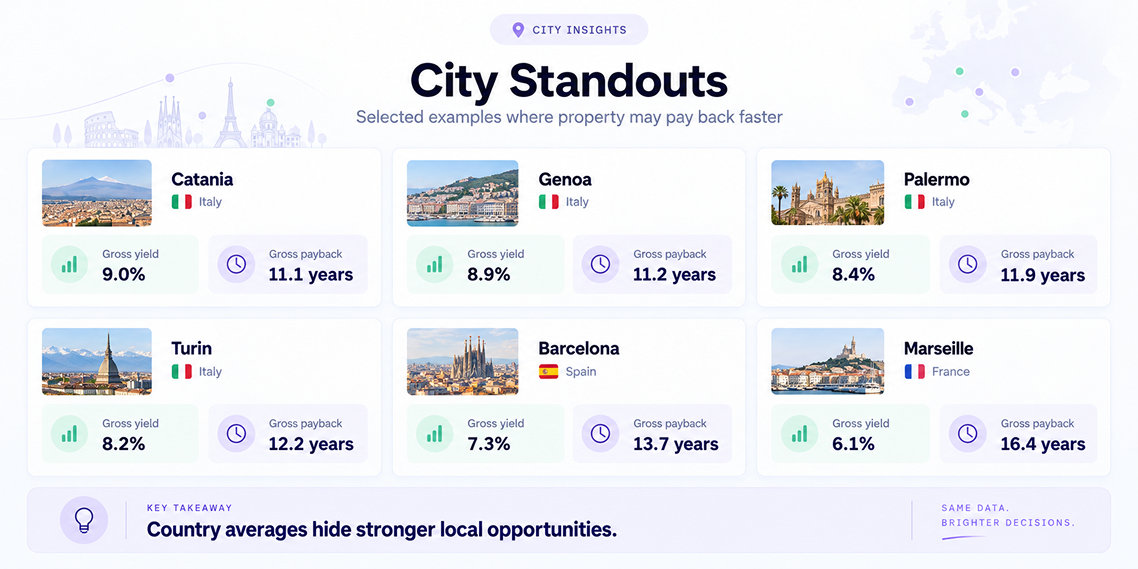
Country averages can hide much better local opportunities
The country ranking suggests:
Italy → Poland → Spain → Portugal → France
when ordered from shortest to longest approximate gross payback.
But once we move to city level, the picture changes.
| Market | Gross Yield | Approx. Gross Payback |
|---|---|---|
| Catania | 9.0% | 11.1 years |
| Genoa | 8.9% | 11.2 years |
| Palermo | 8.4% | 11.9 years |
| Turin | 8.2% | 12.2 years |
| Barcelona | 7.3% | 13.7 years |
| Szczecin | 6.3% | 15.9 years |
| Łódź | 6.2% | 16.1 years |
| Marseille | 6.1% | 16.4 years |
| Sintra | 5.1% | 19.6 years |
Source: BestYieldFinder city-level rental yield data, October 2026.
This is where the price-to-rent ratio becomes more useful.
It allows investors to compare very different markets using the same basic question:
How much rental income am I receiving relative to the price I have to pay?
A shorter payback period does not automatically mean a better investment
This is important.
A market with an 11-year theoretical gross payback is not automatically better than one with a 17-year payback.
The ratio says nothing directly about:
- vacancy risk
- tenant demand
- property condition
- maintenance costs
- taxes
- financing costs
- regulation
- future price growth
- liquidity
- neighborhood quality
A high-yield market can have higher operational or market risk.
A lower-yield market may offer stronger liquidity, appreciation potential or rental stability.
That is why gross payback should be treated as a screening metric, not a final investment decision.
Price-to-rent ratio vs rental yield
These two metrics are closely connected.
Rental yield asks:
“How much annual rental income do I receive as a percentage of the purchase price?”
Price-to-rent ratio asks:
“How many years of gross rental income equal the purchase price?”
For example:
| Gross Yield | Approx. Gross Payback |
|---|---|
| 10% | 10 years |
| 8% | 12.5 years |
| 6% | 16.7 years |
| 5% | 20 years |
| 4% | 25 years |
The information is essentially the same, but the interpretation is different.
For many investors, “12 years of rent” is more intuitive than “8.3% gross yield.”
Apartment type can completely change the result
Another mistake is comparing only city averages.
Within the same city, a 1-bedroom apartment can have a very different price-to-rent ratio from a 3-bedroom property.
For example, current BestYieldFinder data shows significant differences between bedroom segments in markets such as Genoa, Barcelona, Łódź and Sintra.
This happens because additional bedrooms do not always increase rent at the same rate as they increase purchase price.
A larger apartment might cost 40% more but generate only 20% more rent.
In that case, the smaller apartment can have a better price-to-rent ratio.
The reverse can also happen.
This is why investors should compare:
Country → City → District → Apartment Type → Property
rather than relying on a single national yield figure.
How to use price-to-rent data when searching for property
A practical workflow could look like this:
1. Compare countries
Use the Location Explorer to understand the overall relationship between prices, rents and yields.
2. Compare cities
Look for cities where rental income remains strong relative to purchase prices.
3. Compare apartment types
A city’s average can hide large differences between studios, 1BR, 2BR and larger apartments.
4. Go down to district level
Local neighborhoods can produce very different yields within the same city.
The Yield Finder helps identify these local combinations.
5. Compare actual listings
Once an attractive market is identified, investors can use Properties to compare real listings using estimated yield, price, location and property type.
6. Calculate the full investment case
Gross rent is only the starting point.
Use the ROI Calculator to account for the wider economics of the investment.
So where does property pay back faster?
Among the five European markets compared here, Italy currently has the shortest theoretical gross payback period at national level, based on October 2026 apartment rental yields.
But the more important finding is what happens below the country average.
Markets such as:
- Catania
- Genoa
- Palermo
- Turin
- Barcelona
- Marseille
show that the relationship between property prices and rental income can look very different from the national headline.
The best opportunity is therefore not necessarily:
the cheapest country
or
the city with the highest rent.
It is the market where the purchase price, achievable rent, apartment type and local demand work together.
That is exactly why comparing price-to-rent ratios can be such a useful first step in property investment analysis.